Ripple shows clear range expansion on the 4h chart after weeks of compression. Price surged from the base near $1.9 and pushed into a heavy resistance band. Volatility expanded as Bollinger Bands widened, then narrowed as price stalled.
XRP now trades near $2.3 with momentum cooling. The structure reflects profit-taking, not trend failure. Traders are watching how price behaves around the prior breakout zone.
What are the Supports and Resistances
| Level | Price (USD) | Description |
|---|---|---|
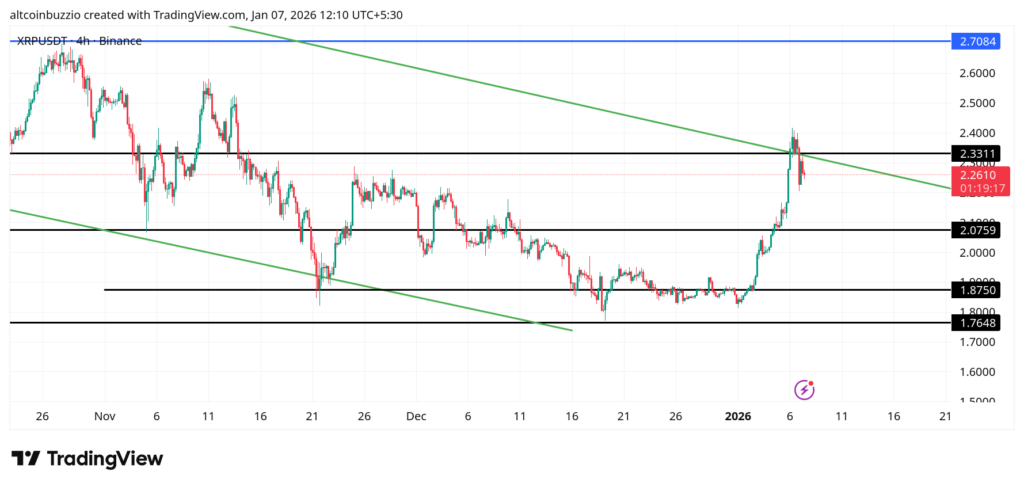
| Support 1 | $2.1 | Former breakout level and prior range top. This zone absorbed pullbacks during the impulse. |
| Support 2 | $1.9 | Range floor and demand base where volatility compressed before expansion. |
| Resistance 1 | $2.3 | Active rejection zone where price stalled after the vertical move. |
| Resistance 2 | $2.7 | Higher timeframe supply aligned with the descending trendline. |
FAQ
What XRP price targets should I consider?
Traders focus on reaction zones, not predictions. The $2.3 area is the first test. Above it, attention shifts toward $2.7 where long-term sellers previously stepped in.
Is XRP Bullish?
The structure is constructive. Price remains above the key supports, and the prior downtrend was broken with strong range expansion.
How do I set stop-loss levels for XRP?
Stops are often placed below invalidation zones. A loss of $2.1 weakens momentum, while a deeper break toward $1.9 signals broader range rotation.
What are the XRP moving averages indicating?
The 20 EMA near $2.2 leads, with the 50 EMA near $2.1 and the 100 EMA near $2.0 stacked below. This alignment shows trend support but flattening slope hints at consolidation.
Should I buy or sell XRP?
This chart favors patience. Price is between support and resistance, where risk increases and follow-through often slows.
How do Fibonacci levels affect XRP price?
Fibonacci levels are not plotted here. Traders typically overlay them on the impulse leg to identify pullback zones that align with EMAs and prior structure.
What does $XRP momentum show?
Momentum cooled after the spike. Bollinger Bands expanded during the rally and are now stabilizing, showing reduced volatility and balance between buyers and sellers.
Conclusion
Ripple remains technically strong but paused at a key ceiling. The trend is intact while price holds above support. The current zone reflects digestion after expansion, not exhaustion. Structure and volatility will define the next phase.

Disclaimer
**The information discussed by Altcoin Buzz is not financial advice. This is for educational, entertainment, and informational purposes only. Any information or strategies presented are the thoughts and opinions of the writer/reviewers, and their risk tolerance may differ from yours. We are not responsible for any losses you may incur due to any investments directly or indirectly related to the information provided. Ripple and other cryptocurrencies are high-risk investments; therefore, please conduct your due diligence. Copyright Altcoin Buzz Pte Ltd.**
The post XRP Trendline Clash Defines Near-Term Risk for Price Action appeared first on Altcoin Buzz.