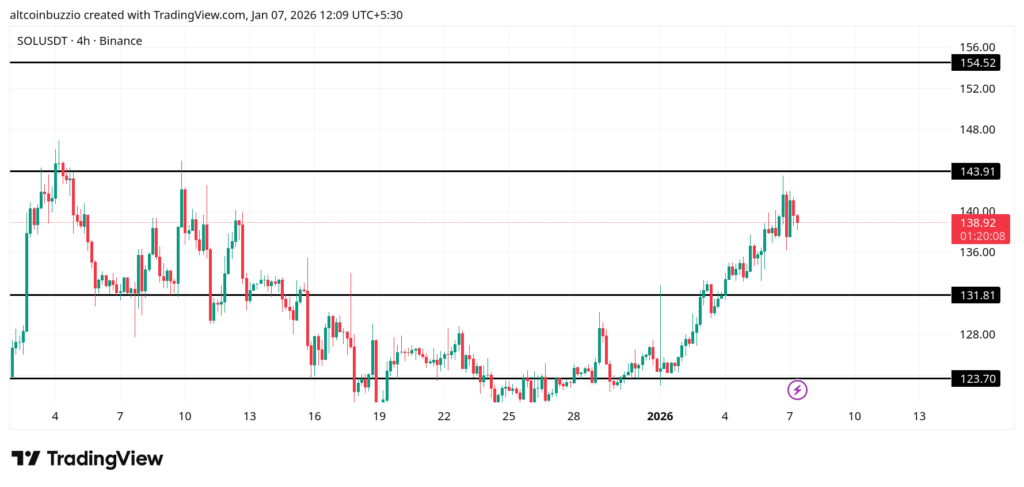
Solana trades near $138.9 on the 4h chart as momentum cools after a fast climb from the base. Price sits above the 20 EMA at $136.8 and well above the 50 EMA at $132.7 and 100 EMA at $130.3.
This Solana EMA stacking shows trend control remains constructive. Bollinger Bands expand after prior compression, with the upper band near $141.6 and the lower band near $124.1. Volatility has increased, but candles now compress under a key ceiling, signaling short-term balance.
What are the Supports and Resistances
| Level | Price (USD) | Description |
|---|---|---|
| Support 1 | $131.8 | Former range top now acting as demand. Buyers defended this zone during the last pullback. |
| Support 2 | $123.7 | Base support aligned with the lower Bollinger Band and prior reaction lows. |
| Resistance 1 | $143.9 | Near-term supply where prior rallies stalled and wicks formed. |
| Resistance 2 | $154.5 | Higher timeframe ceiling that capped price earlier in the range. |
FAQ
What Solana price targets should I consider?
Traders watch $143.9 as the first reaction zone, with $154.5 as the next overhead test if momentum sustains.
Is Solana Bullish?
The trend bias is constructive. Price holds above the 20 EMA at $136.8 with clean EMA separation, though near-term candles show hesitation.
How do I set stop-loss levels for Solana?
Risk is often defined below $131.8, where a loss of structure would place price closer to $123.7.
What are the Solana moving averages indicating?
The 20 EMA at $136.8 leads, followed by the 50 EMA at $132.7 and the 100 EMA at $130.3. Slopes are positive, reflecting trend strength.
Should I buy or sell SOL?
This area favors patience. Price is between $136.8 support and $143.9 resistance, a zone suited for confirmation rather than impulse.
How do Fibonacci levels affect Solana price?
Traders often use retracement confluence within the $131.8 to $143.9 range to gauge pullback depth and reaction strength.
What does $ETH momentum show?
Momentum has slowed after expansion. Volatility rose as bands widened, then compressed as price paused below resistance. Funding appears neutral near 0.0, suggesting balanced positioning.
Conclusion
Solana holds trend structure above key EMAs while pressing into a defined resistance band. The $131.8 to $143.9 range frames near-term decisions. Volatility expanded, then cooled, signaling a market waiting for resolution without losing structure.

Disclaimer
The information discussed by Altcoin Buzz is not financial advice. This is for educational, entertainment, and informational purposes only. Any information or strategies presented are the thoughts and opinions of the writer/reviewers, and their risk tolerance may differ from yours. We are not responsible for any losses you may incur due to any investments directly or indirectly related to the information provided. Solana and other cryptocurrencies are high-risk investments; therefore, please conduct your due diligence. Copyright Altcoin Buzz Pte Ltd.
The post Solana Price Tests Critical Levels After A Fast Surge appeared first on Altcoin Buzz.