Ethereum trades near $2942.4 on the 4h chart as volatility contracts. Price sits between clustered EMAs, with the 20 EMA at $2950.1, the 50 EMA at $2955.4, and the 100 EMA at $2977.7.
Bollinger Bands squeeze around price, with the upper band near $3006.0 and the lower band near $2890.2. This structure shows balance. Momentum pauses while pressure builds around the mid-range.
What are the Supports and Resistances
| Level | Price (USD) | Description |
|---|---|---|
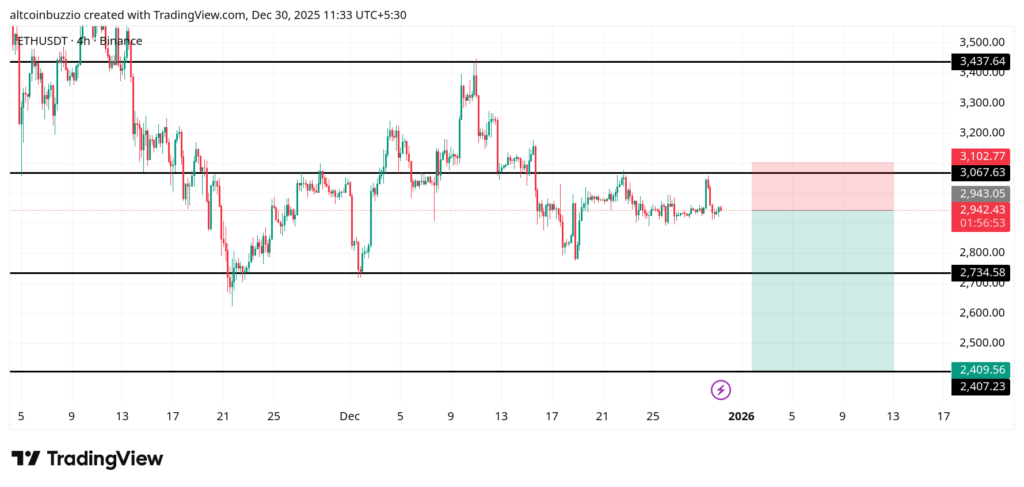
| Support 1 | $2890.2 | Lower Bollinger Band and recent reaction zone where buyers defended dips. |
| Support 2 | $2734.6 | Major horizontal support from prior swing lows with strong historical demand. |
| Resistance 1 | $3067.6 | Range high and prior breakdown area where selling pressure increased. |
| Resistance 2 | $3437.6 | Upper macro resistance marking the previous peak and rejection zone. |
FAQ
What Ethereum price targets should I consider?
Key levels to watch sit at $2890.2 below and $3067.6 above. These define the active range where reactions have been clear.
Is Ethereum Bullish?
Bias is neutral. Price holds near $2942.4 while EMAs flatten and overlap, showing no clear directional control.
How do I set stop-loss levels for Ethereum?
Stops often sit beyond $2890.2 for downside protection or above $3067.6 to manage risk against range breaks.
What are the Ethereum moving averages indicating?
The 20, 50, and 100 EMAs between $2950.1 and $2977.7 are tightly stacked. This reflects consolidation and reduced trend strength.
Should I buy or sell ETH?
The chart favors patience. Compression near $2942.4 suggests waiting for a reaction at range edges rather than acting mid-zone.
How do Fibonacci levels affect Ethereum price?
While not drawn, the $3067.6 and $2734.6 levels align with common retracement zones that often attract liquidity.
What does $ETH momentum show?
Momentum is muted. Candles remain contained within the bands, and funding appears balanced with no strong directional tilt.
Conclusion
Ethereum remains locked in consolidation. Tight Bollinger Bands, flat EMAs, and stable support at $2890.2 define a market in balance. Traders focus on reactions at range extremes as volatility stays compressed.

Disclaimer
The information discussed by Altcoin Buzz is not financial advice. This is for educational, entertainment, and informational purposes only. Any information or strategies presented are the thoughts and opinions of the writer/reviewers, and their risk tolerance may differ from yours. We are not responsible for any losses you may incur due to any investments directly or indirectly related to the information provided. Ethereum and other cryptocurrencies are high-risk investments; therefore, please conduct your due diligence. Copyright Altcoin Buzz Pte Ltd.
The post Ethereum Price Range Holds With Clear Resistance Overhead appeared first on Altcoin Buzz.