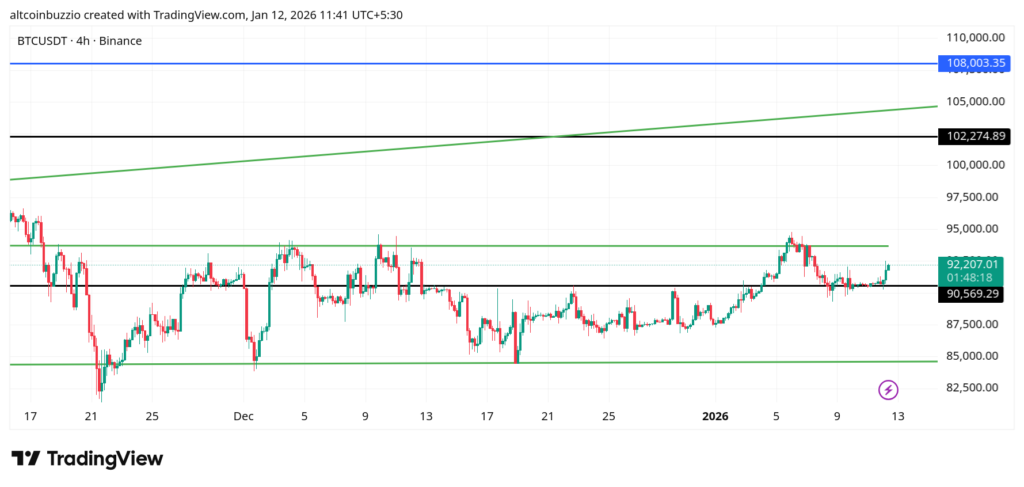
Bitcoin trades on the 4h chart with price stabilizing at $92127.9 after a sharp rebound. The move followed a clean hold above the rising 100 EMA and a push back through a key horizontal level.
Volatility expanded from a compressed range, then cooled as price met the upper Bollinger Band. Momentum is active but controlled, with structure defining the next reaction zones.
What are the Supports and Resistances
| Level | Price (USD) | Description |
|---|---|---|
| Support 1 | $90369.1 | Aligned with the rising 100 EMA. Buyers defended this level during the pullback. |
| Support 2 | $89946.6 | Lower Bollinger Band. Marks the volatility floor of the recent range. |
| Resistance 1 | $91687.3 | Prior horizontal cap near the upper band. Price reacted here before the breakout. |
| Resistance 2 | $92127.9 | Current price zone. Acts as immediate reaction resistance after the impulse. |
FAQ
What Bitcoin price targets should I consider?
Key reaction areas sit near $91687.3 and $92127.9. These zones define where momentum slowed on the chart.
Is Bitcoin Bullish?
Bias is constructive while price holds above $90369.1. EMA structure supports this stance without signaling excess.
How do I set stop-loss levels for Bitcoin?
Stops often sit below $90369.1 or near $89946.6, where volatility support last held.
What are the Bitcoin moving averages indicating?
The 20 EMA at $91038.2 is above the 50 EMA at $90914.6, both trending over the 100 EMA at $90369.1. This stacking shows controlled upside pressure.
Should I buy or sell BTC?
The chart shows structure, not signals. Decisions depend on reactions at $91687.3 and risk defined around $90369.1.
How do Fibonacci levels affect Bitcoin price?
No Fibonacci levels are plotted here. Price is reacting strictly to EMAs, bands, and horizontals.
What does $BTC momentum show?
Momentum expanded with the breakout, then eased as price met the upper band. Funding appears neutral near 0.0, showing balanced positioning.
Conclusion
Bitcoin holds above a reclaimed pivot with EMAs supporting price. Volatility expanded, then normalized. As long as $90369.1 holds, structure stays intact and reactions near $91687.3 define near-term flow.

Disclaimer
**The information discussed by Altcoin Buzz is not financial advice. This is for educational, entertainment, and informational purposes only. Any information or strategies presented are the thoughts and opinions of the writer/reviewers, and their risk tolerance may differ from yours. We are not responsible for any losses you may incur due to any investments directly or indirectly related to the information provided. Bitcoin and other cryptocurrencies are high-risk investments; therefore, please conduct your due diligence. Copyright Altcoin Buzz Pte Ltd.**
The post Bitcoin Volatility Expands After Consolidation appeared first on Altcoin Buzz.