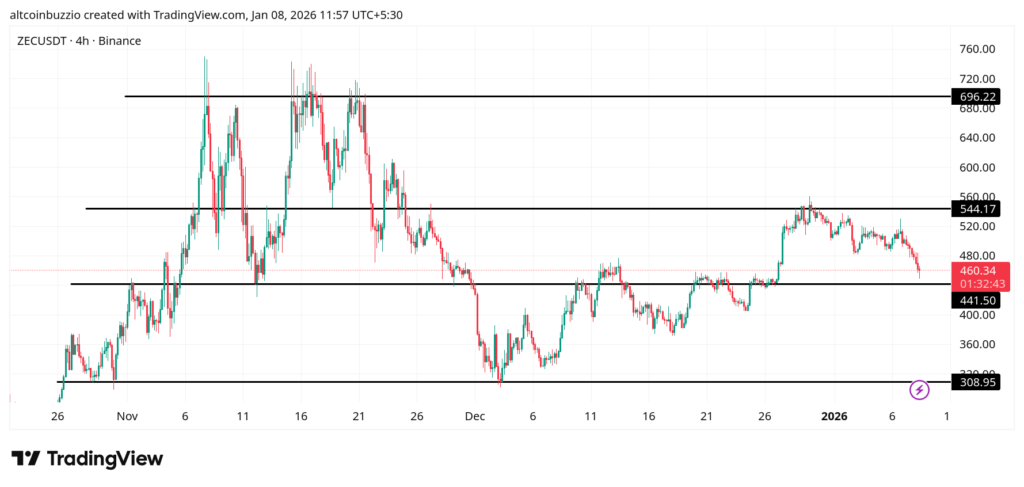
Zcash trades near $460.3 after a sharp rejection from the mid-range. Price now sits below the 20 EMA at $488.6 and the 50 EMA at $495.9. The 100 EMA holds lower at $487.3.
This EMA cluster acts as overhead pressure. Bollinger Bands expand downward, with the lower band near $463.0 and the upper band stretched to $521.5. Volatility has shifted from compression to expansion. Sellers control the short-term slope.
What are the Supports and Resistances
| Level | Price (USD) | Description |
|---|---|---|
| Support 1 | $441.5 | Range floor and prior reaction zone where buyers defended multiple tests. |
| Support 2 | $309.0 | Macro base and final downside buffer from the prior capitulation. |
| Resistance 1 | $544.2 | Mid-range ceiling and former distribution area with heavy supply. |
| Resistance 2 | $696.2 | Major high and long-term rejection level defining the broader range. |
FAQ
What Zcash price targets should I consider?
Traders focus on $441.5 as near-term support and $544.2 as the first upside barrier. These levels frame the active range.
Is Zcash Bullish?
Structure is weak. Price trades below the 20 EMA at $488.6 and momentum slopes down, signaling short-term bearish control.
How do I set stop-loss levels for Zcash?
Stops often sit just below $441.5 for range trades or above $495.9 when fading EMA resistance.
What are the Zcash moving averages indicating?
The 20 EMA at $488.6, 50 EMA at $495.9, and 100 EMA at $487.3 compress overhead. This stacking signals sustained selling pressure.
Should I buy or sell ZEC?
This chart favors reactive decisions at levels, not impulse trades. Price location near support matters more than direction.
How do Fibonacci levels affect Zcash price?
Fibonacci zones align with $441.5 and $544.2, reinforcing them as reaction levels where flow often shifts.
What does $ZEC momentum show?
Momentum rolls over as price hugs the lower Bollinger Band at $463.0. Volatility expands with downside bias.
Conclusion
Zcash trades under key averages with expanding volatility. The $441.5 support defines near-term risk, while $544.2 caps recovery attempts. Structure remains range-bound with bearish short-term pressure.
Disclaimer
**The information discussed by Altcoin Buzz is not financial advice. This is for educational, entertainment, and informational purposes only. Any information or strategies presented are the thoughts and opinions of the writer/reviewers, and their risk tolerance may differ from yours. We are not responsible for any losses you may incur due to any investments directly or indirectly related to the information provided. Zcash and other cryptocurrencies are high-risk investments; therefore, please conduct your due diligence. Copyright Altcoin Buzz Pte Ltd.**
The post Zcash ZEC Price Slides Below Key Averages in Trend Shift appeared first on Altcoin Buzz.