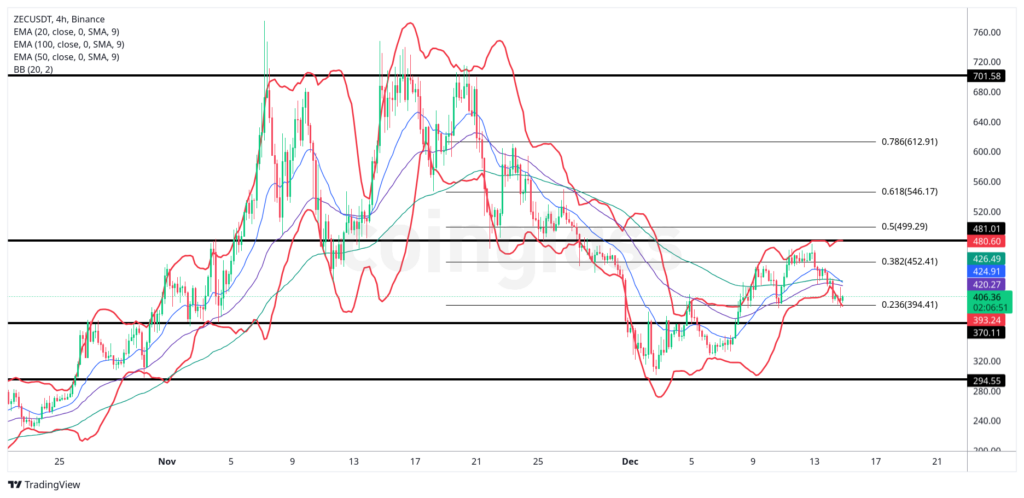
Zcash trades near $406.7 on the 4-hour chart, locked inside a tightening structure. Price sits below the 20 EMA at $420.3, the 50 EMA at $424.9, and the 100 EMA at $426.5. This downward EMA stack signals controlled bearish pressure rather than panic.
Bollinger Bands narrow between $480.6 and $393.3, confirming volatility contraction after the prior expansion leg. The OI-weighted funding rate prints near 0.0, showing balanced positioning with no aggressive leverage on either side. Momentum remains muted as price grinds sideways along a critical Fibonacci retracement.
What are the Supports and Resistances
| Level | Price (USD) | Description |
|---|---|---|
| Support 1 | $394.4 | 0.236 Fibonacci retracement where buyers repeatedly defend pullbacks. |
| Support 2 | $370.1 | Structural base aligned with prior reaction lows and demand absorption. |
| Resistance 1 | $481.0 | 0.500 Fibonacci level and range midpoint acting as firm supply. |
| Resistance 2 | $701.6 | Upper macro resistance tied to earlier distribution highs. |
FAQ
What Zcash price targets should I consider?
Short-term focus remains on $394.4 as the immediate Fibonacci support and $481.0 as the primary upside barrier where sellers previously regained control.
Is Zcash Bullish?
The structure is neutral to weak. Price trades below all major EMAs, and slope direction shows controlled downside pressure without acceleration.
How do I set stop-loss levels for Zcash?
Many traders place invalidation below $370.1, where the structure would lose its current Fibonacci-based support.
What are the Zcash moving averages indicating?
The 20, 50, and 100 EMAs cluster above price and slope lower, signaling that rebounds face immediate overhead pressure.
Should I buy or sell ZEC?
The chart suggests patience. Price remains boxed between $394.4 and $481.0 with no expansion signal yet.
How do Fibonacci levels affect Zcash price?
Zcash respects multiple retracements. The 0.236 sits at $394.4, the 0.382 at $452.4, the 0.500 at $499.3, the 0.618 at $546.2, and the 0.786 at $612.9, creating layered reaction zones for traders.
What does $ZEC momentum show?
Momentum is flat. Bollinger Band compression and a near-0.0 funding rate confirm low conviction and balanced leverage.
Conclusion
Zcash remains compressed near $406.7 as Fibonacci structure guides price behavior. The $394.4 support defines short-term risk, while $481.0 caps recovery attempts. EMA stacking, tight Bollinger Bands, and neutral funding all point to indecision rather than trend continuation. Traders continue to monitor this range for volatility expansion and decisive reactions at Fibonacci levels.
Disclaimer
The information discussed by Altcoin Buzz is not financial advice. This is for educational, entertainment, and informational purposes only. Any information or strategies presented are the thoughts and opinions of the writer/reviewers, and their risk tolerance may differ from yours. We are not responsible for any losses you may incur due to any investments directly or indirectly related to the information provided. Zcash and other cryptocurrencies are high-risk investments; therefore, please conduct your due diligence. Copyright Altcoin Buzz Pte Ltd.
The post ZEC Price Retracement Over? When Can ZEC Pump to ATH? appeared first on Altcoin Buzz.