What are the levels to mark in your chart? Stay till the end to uncover impactful price clues most traders miss.
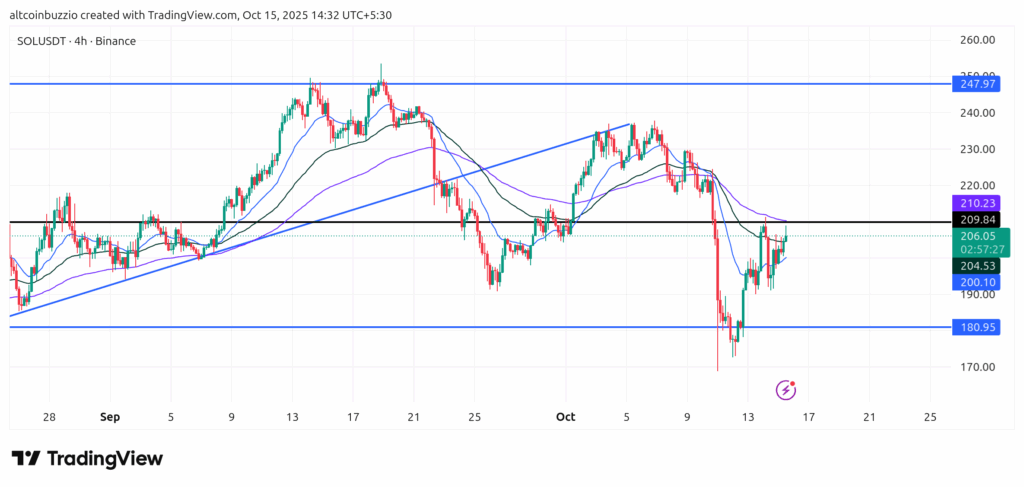
Solana trades at $206 today. $SOL is above the significant support level of $185. This is a crucial area. Watch for further price action. Discover the next targets. Traders can plan strategies.
What are the support and resistance levels for $SOL?
| Level | Price (USD) | Description |
|---|---|---|
| Support 1 | $185 | 100 EMA is the 100-day Exponential Moving Average. It is the average price over the last 100 days. It shows market trends over a mid or long term. |
| Support 2 | $170 | Bollinger Bands are volatility bands. They expand and contract based on the market volatility. The lower Bollinger Band is the lower deviation from the 20-day simple moving average. |
| Resistance 1 | $215 | 50 EMA is the 50-day Exponential Moving Average. It is the average price over the last 50 days. It shows market trends over a short or mid-term. |
| Resistance 2 | $230 | Upper Bollinger Band is the upper deviation from the 20-day simple moving average. |
FAQ
What price targets should I consider for Solana $SOL?
Support is at $185. This level is important. Resistance sits near $230. Traders target $292 for extension. Plan your trades wisely. Monitor these key levels.
Should I sell Solana to take profits or wait?
Stochastic RSI reads 35. Momentum is not strong. Resistance sits at $230. Consider profit taking there. Place stop-loss below $170. Protect your capital. Always manage risk.
How do I set stop-loss levels for Solana?
Place stops below $170 support. This protects your trade. Consider using swing lows. These are strong reference points. Always use a stop loss. It limits downside risk.
What are the Solana moving averages indicating?
EMA50 is at $215. EMA100 is at $185. Solana trades at $206 now. Price is between these averages. This shows a neutral trend. Compare these values carefully. Determine trend direction. Make informed decisions.
What should a buyer or seller do?
Buyers can enter near $185 or $170. These are good entry points. Place stops below $170. This protects positions. Sellers can exit near $215 or $230. Take profits at $292. Manage your risk carefully. Always use strict stop-losses.
How do Fibonacci levels affect Solana price?
Fibonacci 61.8% level sits at $176. This is strong support. Fibonacci 138.2% extension targets $292. This is a future profit target. Understand these critical levels. They guide price action.
What does $SOL momentum show?
Stochastic RSI K reads 35. Values above 80 mean overbought. Values below 20 mean oversold. And, values between 20-80 show neutral momentum. Current momentum is neutral to weak. Watch for changes. Confirm trade direction.
Conclusion
Solana shows weakness below $185 support. This is a bearish signal. Eyes on $170 for breakdown risk. A move lower is possible. Momentum favors bears now. Another sell-off may follow. Stay cautious. Protect capital. Trade wisely.

Disclaimer
The information discussed by Altcoin Buzz is not financial advice. This is for educational, entertainment, and informational purposes only. Any information or strategies presented are the thoughts and opinions of the writer/reviewers, and their risk tolerance may differ from yours. We are not responsible for any losses you may incur due to any investments directly or indirectly related to the information provided. Solana and other cryptocurrencies are high-risk investments; therefore, please conduct your due diligence. Copyright Altcoin Buzz Pte Ltd.
The post SOL Coiling Near Resistance: 7 Levels Traders Must Mark appeared first on Altcoin Buzz.