Is a big pump coming, or is a dump ahead? Find top trading signals now. Read to the end to catch hidden XRP setups.
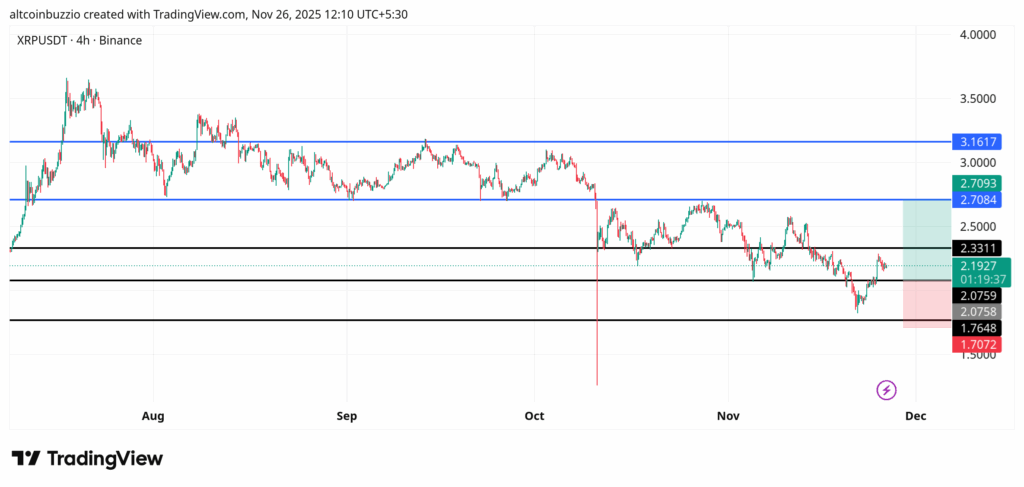
Ripple trades at $2.19 today. $XRP is above the significant support level of $1.85. Discover the next targets.
What are the support and resistance levels for $XRP?
| Level | Price (USD) | Description |
|---|---|---|
| Support 1 | $1.95 | 100 EMA is the 100-day Exponential Moving Average. It is the average price over the last 100 days. It shows market trends over a mid or long term. |
| Support 2 | $1.80 | Bollinger Bands are volatility bands. They expand and contract based on market volatility. The lower Bollinger Band is the lower deviation from the 20-day simple moving average. |
| Resistance 1 | $2.28 | 50 EMA is the 50-day Exponential Moving Average. It is the average price over the last 50 days. It shows market trends over a short or mid-term. |
| Resistance 2 | $2.35 | Upper Bollinger Band is the upper deviation from the 20-day simple moving average. |
FAQ
What XRP price targets should I consider?
Support at $1.85 holds firm. Resistance near $2.35 is a key level. A move above $2.35 is bullish. Extension target $4.17 suggests big upside. Watch these levels closely.
Is XRP Bullish?
Stochastic RSI is 92. This shows overbought conditions. Resistance sits at $2.35. A push past $2.35 confirms the bullish trend. Place stop-loss below $1.80. Protect your capital always.
How do I set stop-loss levels for Ripple?
Place stops below $1.80 support. This is a critical zone. Consider using swing lows as reference points. A break below $1.80 shows weakness. Manage risk wisely.
What are the Ripple moving averages indicating?
EMA50 is at $2.28. EMA100 is at $1.95. Ripple trades at $2.19. The price is below EMA50. It sits above EMA100. This suggests a mixed short-term trend. Long-term trend holds bullish bias.
Should I buy or sell XRP?
Buyers can enter near $1.90 or $1.85. Place stops below $1.80 for safety. Sellers can exit near $2.35 or $2.50. Take profits at $4.17. Price action is key. Manage your risk carefully.
How do Fibonacci levels affect Ripple price?
Fibonacci 61.8% level sits at $2.56. This is a strong resistance point. Fibonacci 138.2% extension targets $4.17. This offers a major profit target.
What does $XRP momentum show?
Stochastic RSI K reads 92. Values above 80 mean overbought conditions. Values below 20 mean oversold conditions. And values between 20-80 show neutral momentum. Currently, $XRP is overbought. This can precede a pullback. Or it can signal a strong breakout. Watch volume for confirmation.
Conclusion
$XRP shows strong potential. Current price is $2.19. Key support is $1.85. Resistance at $2.35 is crucial. Overbought RSI needs attention. A breakout above $2.35 is bullish. Profit targets are high. Always manage your risk.

Disclaimer
The information discussed by Altcoin Buzz is not financial advice. This is for educational, entertainment, and informational purposes only. Any information or strategies presented are the thoughts and opinions of the writer/reviewers, and their risk tolerance may differ from yours. We are not responsible for any losses you may incur due to any investments directly or indirectly related to the information provided. Ripple and other cryptocurrencies are high-risk investments; therefore, please conduct your due diligence. Copyright Altcoin Buzz Pte Ltd.
The post Ripple Dip Opportunity: XRP Buy Zones and Targets appeared first on Altcoin Buzz.