BNB grinds lower as price presses a tight support shelf under falling averages.
BNB trades near a compressed zone after repeated failures above clustered moving averages. The 100 EMA at $885.8 slopes down and caps rebounds. Bollinger Bands squeeze after a brief expansion, with the upper band near $912.7 and the lower band near $850.0. This structure reflects fading upside pressure and limited follow-through on bounces. Funding bars lean red, signaling cautious positioning.
What are the Supports and Resistances
| Level | Price (USD) | Description |
|---|---|---|
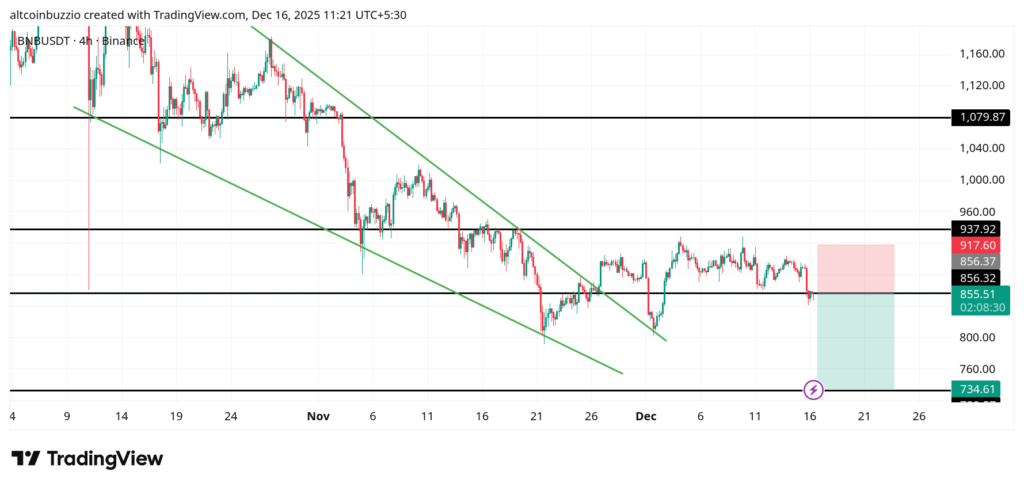
| Support 1 | $856.3 | Near-term shelf where price reacts and volatility compresses. |
| Support 2 | $734.6 | Lower range base aligned with prior demand and channel support. |
| Resistance 1 | $937.9 | Mid-range cap where sellers previously absorbed rallies. |
| Resistance 2 | $1079.9 | Upper ceiling from earlier distribution and trend rejection. |
FAQ
What BNB price targets should I consider?
Traders focus on reactions around $856.3 for stability and $937.9 for supply. These zones frame short-term decisions.
Is BNB Bullish?
The structure is neutral to soft. Price sits below the $875.2 and $882.0 EMAs, with the $885.8 EMA sloping down.
How do I set stop-loss levels for BNB?
Stops often sit just beyond $856.3 for tight risk, or below $734.6 for wider swings tied to range failure.
What are the BNB moving averages indicating?
EMA stacking is bearish. The 20 EMA at $875.2 is below the 50 EMA at $882.0, both under the 100 EMA at $885.8.
Should I buy or sell BNB?
The chart favors patience. Price at $855.5 remains below resistance and inside a compressed band.
How do Fibonacci levels affect BNB price?
No Fibonacci levels are drawn here. Traders instead gauge reactions at $856.3 and $937.9 for proportional moves.
What does $BNB momentum show?
Momentum is muted. Bollinger Bands tighten between $912.7 and $850.0 while funding skews slightly negative.
Conclusion
BNB holds a fragile base near $856.3 under declining averages. Compression suggests a decisive test ahead, with $937.9 and $734.6 defining risk.
Disclaimer
**The information discussed by Altcoin Buzz is not financial advice. This is for educational, entertainment, and informational purposes only. Any information or strategies presented are the thoughts and opinions of the writer/reviewers, and their risk tolerance may differ from yours. We are not responsible for any losses you may incur due to any investments directly or indirectly related to the information provided. BNB and other cryptocurrencies are high-risk investments; therefore, please conduct your due diligence. Copyright Altcoin Buzz Pte Ltd.**
The post Four BNB Price Indicators Point To Cautious Outlook appeared first on Altcoin Buzz.