Look for clear signals in the chart. Read to the end. You’ll find hidden price targets most traders miss.
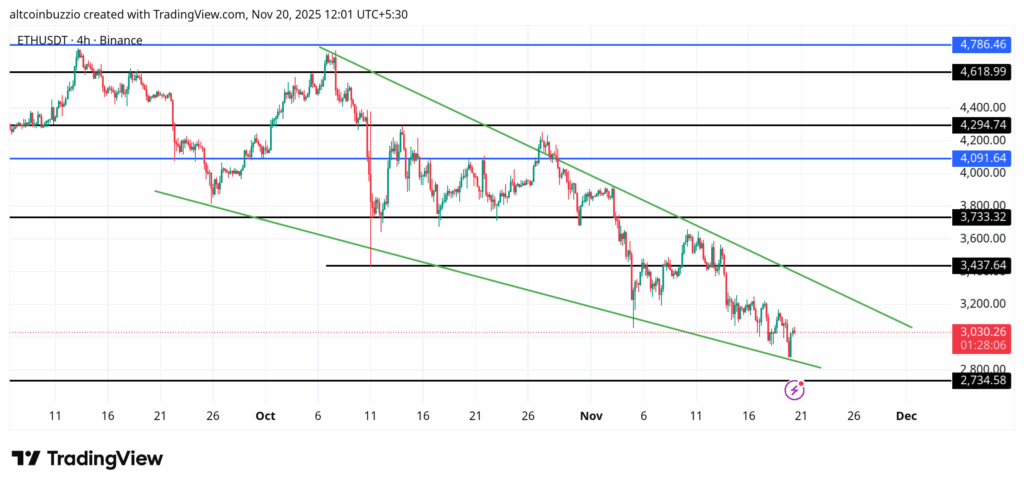
Ethereum trades at $3026. This price is above $2950 support. Discover next targets.
What are the support and resistance levels for $ETH?
| Level | Price (USD) | Description |
|---|---|---|
| Support 1 | $2950 | 100 EMA is the 100-day Exponential Moving Average. It is the average price over the last 100 days. It shows market trends over a mid or long term. |
| Support 2 | $2880 | Bollinger Bands are volatility bands. They expand and contract based on the market volatility. The lower Bollinger Band is the lower deviation from the 20-day simple moving average. |
| Resistance 1 | $3080 | 50 EMA is the 50-day Exponential Moving Average. It is the average price over the last 50 days. It shows market trends over a short or mid-term. |
| Resistance 2 | $3150 | Upper Bollinger Band is the upper deviation from the 20-day simple moving average. |
FAQ
What Ethereum price targets should I consider?
Support at $2950. Resistance near $3080. Extension target $5823.
Is Ethereum Bullish?
Stochastic RSI is 55. Resistance sits at $3080. Place stop-loss below $2850.
How do I set stop-loss levels for Ethereum?
Place stops below $2850 support. Consider using swing lows as reference points.
What are the Ethereum moving averages indicating?
EMA50 is $3080. EMA100 is $2950. Ethereum trades at $3026. Compare prices. Find the trend.
Should I buy or sell ETH?
Buy near $2950. Or enter near $2880. Place stops below $2850. Sell near $3080. Consider $3150 for selling. Take profits at $5823. Manage risk carefully.
How do Fibonacci levels affect the Ethereum price?
Fibonacci 61.8% is $3221. Fibonacci 138.2% extension targets $5823.
What does $ETH momentum show?
Stochastic RSI K reads 55. Over 80 means overbought. Under 20 means oversold. Values 20-80 show neutral momentum.
Conclusion
Ethereum shows weakness below $2950 support. Eyes on $2950 for breakdown risk. Momentum favours bears. Another sell-off may follow. Stay cautious, protect capital.

Disclaimer
This Altcoin Buzz information is not financial advice. It is for education and entertainment only. It is for informational purposes only. Opinions are the writer’s thoughts. Risk tolerance may differ from yours. We are not responsible for losses. This includes any related investments. Cryptocurrencies are high-risk. Please conduct your own research. Copyright Altcoin Buzz Pte Ltd.
The post $ETH Price Surge Ahead? Falling Wedge Pattern Active appeared first on Altcoin Buzz.