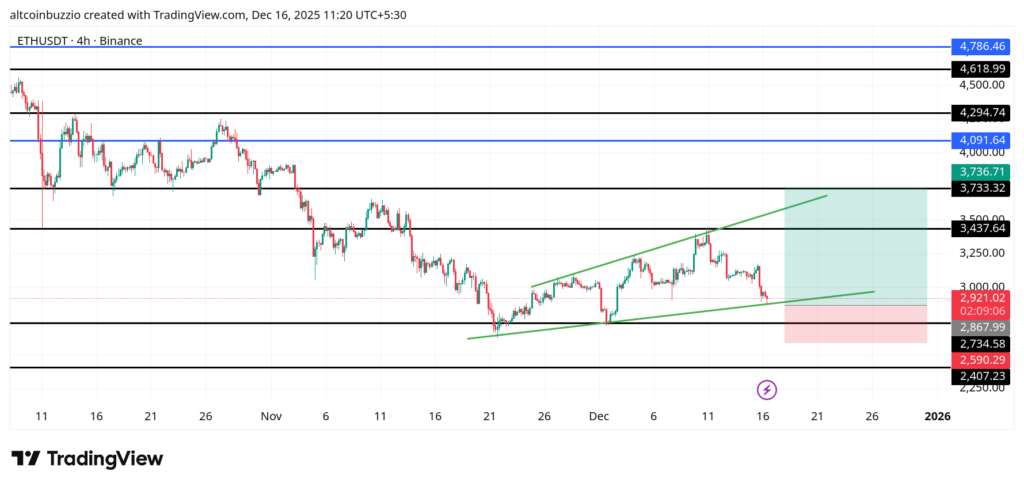
Ethereum tightens inside a rising channel as price presses a lower boundary.
Ethereum trades near $2927.4 after a sharp pullback from the channel top. Volatility has expanded after a prior squeeze, and candles now test a key reaction zone. EMA clustering overhead adds pressure, forcing traders to watch for clean responses at defined levels.
What are the Supports and Resistances
| Level | Price (USD) | Description |
|---|---|---|
| Support 1 | $2868.0 | Rising channel base and recent swing defense. |
| Support 2 | $2734.6 | Prior breakdown shelf with historical demand. |
| Resistance 1 | $3437.6 | Channel ceiling and rejection zone. |
| Resistance 2 | $3733.3 | Higher-timeframe supply near range highs. |
FAQ
What Ethereum price targets should I consider?
Price reactions center around $2868.0 on the downside and $3437.6 on the upside. These zones align with trend structure and recent rejections.
Is Ethereum Bullish?
Structure remains constructive within a rising channel, but momentum is soft as price trades below clustered EMAs near $3099.7 and $3098.6.
How do I set stop-loss levels for Ethereum?
Stops often sit below $2868.0, where a clean loss would break the channel base and expose $2734.6.
What are the Ethereum moving averages indicating?
The 20 EMA at $3099.7, 50 EMA at $3095.0, and 100 EMA at $3098.6 are tightly stacked. This compression signals balance but caps short-term rallies.
Should I buy or sell ETH?
Decisions hinge on reactions at $2868.0 and acceptance back above $3099.7. The chart favors patience while price resolves this squeeze.
How do Fibonacci levels affect Ethereum price?
Fibonacci tools typically align with prior swing zones. On this chart, reactions already respect horizontal levels, reducing the need for added retracements.
What does $ETH momentum show?
Momentum cooled after a push toward $3437.6. Bollinger Bands show expansion, with price leaning toward the lower band near $2920.9.
Conclusion
Ethereum sits at a decision point. Rising structure supports price, but EMA resistance and expanding volatility demand confirmation. Traders should focus on clean reactions at $2868.0 and $3437.6 before committing risk.
Disclaimer
The information discussed by Altcoin Buzz is not financial advice. This is for educational, entertainment, and informational purposes only. Any information or strategies presented are the thoughts and opinions of the writer/reviewers, and their risk tolerance may differ from yours. We are not responsible for any losses you may incur due to any investments directly or indirectly related to the information provided. Ethereum and other cryptocurrencies are high-risk investments; therefore, please conduct your due diligence. Copyright Altcoin Buzz Pte Ltd.
The post ETH Price Faces EMA Pressure In Tight Consolidation appeared first on Altcoin Buzz.