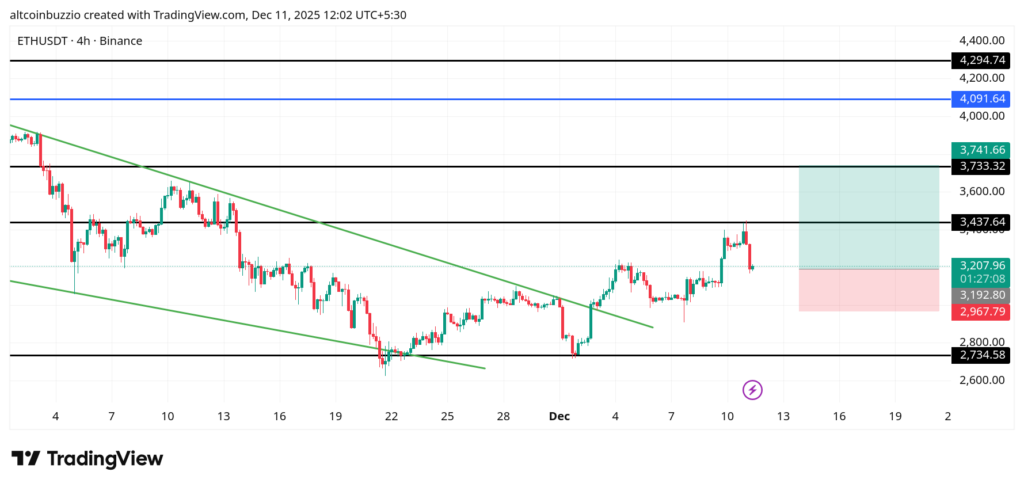
Ethereum pulls back from the upper Bollinger Band at $3420.0 and now trades near $3208.9. The 20 EMA at $3228.9 flattens, while the 50 EMA at $3148.3 and 100 EMA at $3106.5 rise with steady slope.
This creates a layered demand zone under price. The Bollinger Bands remain wide after an expansion phase, hinting that volatility has not yet cooled. Funding stays neutral near the zero line with no visible shift. Pressure now forms between the mid-band near $3228.9 and the recent rejection at $3420.0.
What are the Support and Resistance?
| Level | Price (USD) | Description |
|---|---|---|
| Support 1 | $3148.3 | 50 EMA zone where recent dips found reaction |
| Support 2 | $3106.5 | 100 EMA base and lower compression shelf |
| Resistance 1 | $3437.6 | Local rejection zone near upper band |
| Resistance 2 | $3733.3 | Next major reaction level from prior structure |
FAQ
What Ethereum price targets should I consider?
Traders watch the $3148.3 to $3437.6 band. Price reacts cleanly at each edge, showing active order flow.
Is Ethereum Bullish?
EMAs slope upward, but the rejection at $3420.0 shows supply. Trend leans constructive yet contested.
How do I set stop-loss levels for Ethereum?
Many traders anchor stops below the 100 EMA at $3106.5 because it marks the last stable support cluster.
What are the Ethereum moving averages indicating?
The 20 EMA at $3228.9 is flat, while the 50 EMA at $3148.3 and 100 EMA at $3106.5 rise. This signals steady demand but short-term hesitation.
Should I buy or sell ETH?
The chart shows a compression band, not a clear push. Traders often wait for break strength above $3437.6 or stability above $3148.3.
How do Fibonacci levels affect Ethereum price?
The visible structure shows reactions near mid-range levels, yet no direct Fibonacci markings appear on this chart.
What does $ETH momentum show?
Momentum cooled after tagging $3420.0. Price now moves sideways as volatility resets.
Conclusion
Ethereum trades inside a tight mid-range bracket. EMAs build support below, while upper rejection still caps movement. Traders watch for a clean break from this compression zone.

Disclaimer
The information provided by Altcoin Buzz is not financial advice. It is intended solely for educational, entertainment, and informational purposes. Any opinions or strategies shared are those of the writer/reviewers, and their risk tolerance may differ from yours. We are not liable for any losses you may incur from investments related to the information given. Bitcoin and other cryptocurrencies are high-risk assets; therefore, conduct thorough due diligence. Copyright Altcoin Buzz Pte Ltd.
The post EMA Support Holds While ETH Price Tests Resistance appeared first on Altcoin Buzz.