Bitcoin trades below a major horizontal barrier while volatility contracts. Price holds near $87147.6 after a sharp rejection from the mid-band. The 20 EMA at $86997.8 curls flat, pressing into the 50 EMA at $88177.9.
The 100 EMA at $89256.5 slopes down and caps recovery attempts. Bollinger Bands narrow between $88605.6 and $84969.7, signaling reduced expansion. This structure keeps pressure balanced and reactive rather than directional.
What are the Supports and Resistances
| Level | Price (USD) | Description |
|---|---|---|
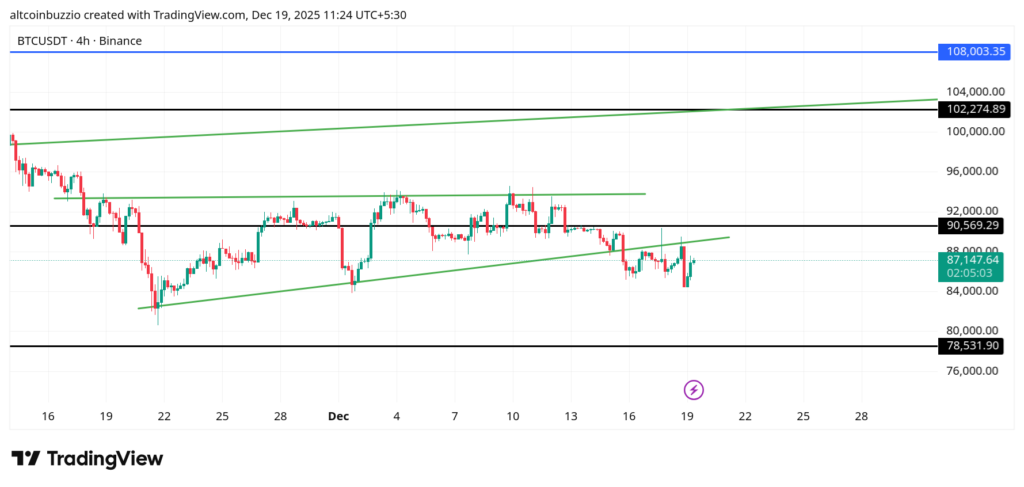
| Support 1 | $84969.7 | Lower Bollinger Band zone where bids previously absorbed sell pressure. |
| Support 2 | $78531.9 | Higher-timeframe floor that marks the lower boundary of the broader range. |
| Resistance 1 | $90569.3 | Mid-range ceiling that repeatedly stalled rebounds. |
| Resistance 2 | $91627.3 | Primary horizontal cap aligned with EMA congestion. |
FAQ
What Bitcoin price targets should I consider?
Key reaction zones sit at $88605.6 near the upper band and $84969.7 near the lower band. These levels frame short-term trade decisions.
Is Bitcoin Bullish?
Momentum is neutral. Price trades below the 100 EMA at $89256.5 while EMAs flatten, showing balance rather than trend strength.
How do I set stop-loss levels for Bitcoin?
Stops often sit just beyond $84969.7 on downside tests or above $91627.3 on failed upside probes to limit whipsaw risk.
What are the Bitcoin moving averages indicating?
The 20 EMA at $86997.8 and 50 EMA at $88177.9 compress together, reflecting indecision. The 100 EMA at $89256.5 remains a downward filter.
Should I buy or sell BTC?
The chart favors patience. Range trading dominates while price remains boxed between $84969.7 and $91627.3.
How do Fibonacci levels affect Bitcoin price?
Visible reactions cluster near mid-range retracement behavior around $90569.3, reinforcing it as a decision point.
What does $BTC momentum show?
The funding-rate histogram prints close to neutral, suggesting balanced positioning and limited directional conviction.
Conclusion
Bitcoin remains compressed with flat EMAs, narrow bands, and muted funding tone. Traders are watching reactions at $84969.7 and $91627.3 as volatility waits for release.

Disclaimer
**The information discussed by Altcoin Buzz is not financial advice. This is for educational, entertainment, and informational purposes only. Any information or strategies presented are the thoughts and opinions of the writer/reviewers, and their risk tolerance may differ from yours. We are not responsible for any losses you may incur due to any investments directly or indirectly related to the information provided. Bitcoin and other cryptocurrencies are high-risk investments; therefore, please conduct your due diligence. Copyright Altcoin Buzz Pte Ltd.**
The post Bitcoin Price Retests Trendline: Bearish Trend to Continue? appeared first on Altcoin Buzz.