Traders are watching this move closely. Look for clear signals in the chart. Read to the end. You’ll find hidden price targets most traders miss.
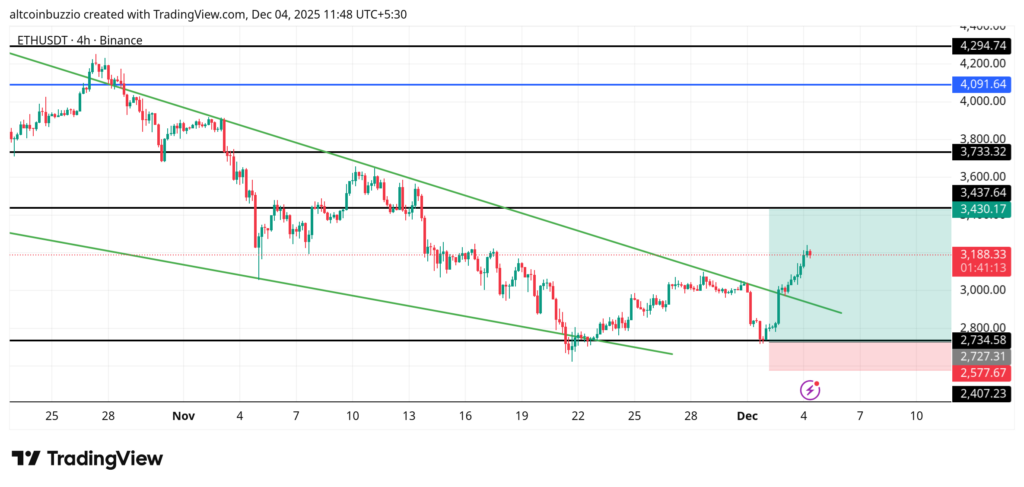
Ethereum trades at $3191 today. ETH is above $3100 support. This level is key. Bears test this area. Watch for a bounce. Or a breakdown. Big moves are coming. Discover next targets.
What are the support and resistance levels for $ETH?
| Level | Price (USD) | Description |
|---|---|---|
| Support 1 | $3100 | 100 EMA is the 100-day Exponential Moving Average. It is the average price over the last 100 days. It shows market trends over a mid or long term. |
| Support 2 | $3020 | Bollinger Bands are volatility bands. They expand and contract based on the market volatility. Lower Bollinger Band is the lower deviation from the 20-day simple moving average. |
| Resistance 1 | $3230 | 50 EMA is the 50-day Exponential Moving Average. It is the average price over the last 50 days. It shows market trends over a short or mid-term. |
| Resistance 2 | $3310 | Upper Bollinger Band is the upper deviation from the 20-day simple moving average. |
FAQ
What Ethereum price targets should I consider?
Support at $3100. Resistance near $3230. Next resistance is $3310. Extension target $5823. Watch these levels closely.
Is Ethereum Bullish?
Stochastic RSI is 25. This shows bearish momentum. Resistance sits at $3230. Place stop-loss below $3020. Protect your investment.
How do I set stop-loss levels for Ethereum?
Place stops below $3020 support. This is the Lower Bollinger Band. It provides a strong floor. Consider using swing lows. They are good reference points.
What are the Ethereum moving averages indicating?
EMA50 is at $3230. EMA100 is at $3100. Ethereum trades at $3191. Price is below EMA50. This signals weakness. Price is above EMA100. This offers support. Compare values for trend.
Should I buy or sell ETH?
Buy near $3100. Also buy near $3020. Place stops below $3020. This protects capital. Sell near $3230. Also sells near $3310. These are resistance levels. Take profits at $5823. Always manage your risk well.
How do Fibonacci levels affect the Ethereum price?
Fibonacci 61.8% level sits at $3221. Fibonacci 138.2% extension targets $5823.
What does $ETH momentum show?
Stochastic RSI K reads 25. This indicates weakness. Values above 80 show overbought. Values below 20 show oversold. And, Values between 20-80 show neutral. Momentum is bearish now. Watch for reversal signals.
Conclusion
Ethereum shows weakness below $3230. Eyes on $3100 for breakdown risk. Momentum favours bears. The Stochastic RSI is low. Another sell-off may follow. This is a crucial time. Stay cautious. Protect your capital. Trade smart.

Disclaimer
The information discussed by Altcoin Buzz is not financial advice. This is for educational, entertainment, and informational purposes only. Any information or strategies presented are the thoughts and opinions of the writer/reviewers, and their risk tolerance may differ from yours. We are not responsible for any losses you may incur due to any investments directly or indirectly related to the information provided. Ethereum and other cryptocurrencies are high-risk investments; therefore, please conduct your due diligence. Copyright Altcoin Buzz Pte Ltd.
The post ETH Price Tests Key Levels Ahead of Major Shift appeared first on Altcoin Buzz.