What are the levels to mark in your chart? Stay till the end to uncover impactful price clues most traders miss.
Solana trades at $139 today. $SOL is above the significant support level of $130. Discover the next targets.
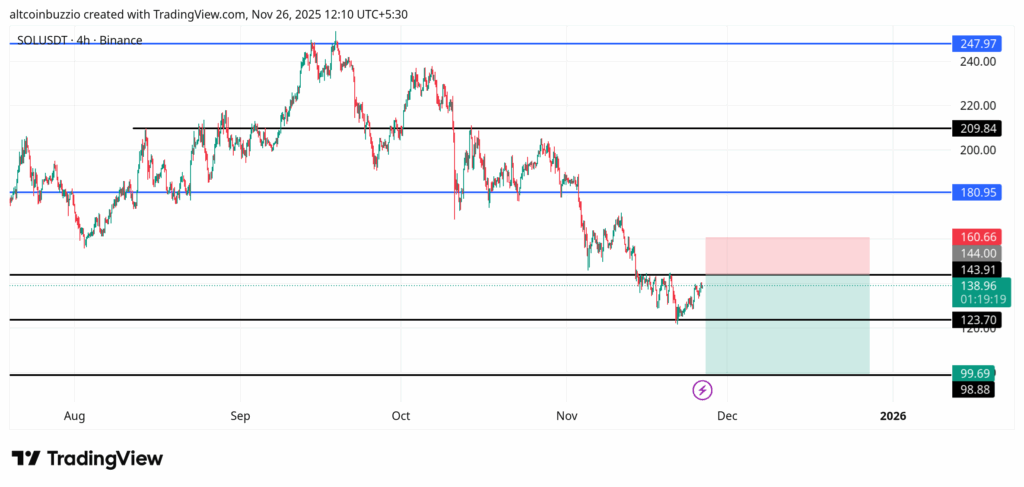
What are the support and resistance levels for $SOL?
| Level | Price (USD) | Description |
|---|---|---|
| Support 1 | $130 | 100 EMA is the 100-day Exponential Moving Average. It is the average price over the last 100 days. It shows market trends over a mid or long term. |
| Support 2 | $120 | Bollinger Bands are volatility bands. They expand and contract based on the market volatility. The lower Bollinger Band is the lower deviation from the 20-day simple moving average. |
| Resistance 1 | $145 | 50 EMA is the 50-day Exponential Moving Average. It is the average price over the last 50 days. It shows market trends over a short or mid-term. |
| Resistance 2 | $155 | Upper Bollinger Band is the upper deviation from the 20-day simple moving average. |
FAQ
What Solana price targets should I consider?
Support sits at $130. Resistance nears $145. The extension target is $293.
Is Solana Bullish?
Stochastic RSI reads 25. This shows bearish momentum. Resistance sits at $145. Place stop-loss below $120.
How do I set stop-loss levels for Solana?
Place stops below $120 support. This level is crucial. Consider using past swing lows. These provide good reference points.
What are the Solana moving averages indicating?
EMA50 is at $145. EMA100 is at $130. Solana trades at $139. Price is between these EMAs. This indicates consolidation. Or a potential trend change.
Should I buy or sell SOL?
Buyers can enter near $130 or $120. Place stops below $120. Sellers can exit near $145 or $155. Take profits at $293. Manage your risk carefully. Always use proper position sizing.
How do Fibonacci levels affect Solana price?
Fibonacci 61.8% level sits at $173. This is a key resistance. Fibonacci 138.2% extension targets $293. This marks an ambitious long-term goal.
What does $SOL momentum show?
Stochastic RSI K reads 25. Values above 80 mean overbought. Values below 20 mean oversold. And, Values between 20-80 show neutral momentum. A reading of 25 is oversold. This suggests a potential bounce. But the current trend is down.
Conclusion
Solana shows weakness below $130 support. Eyes are on $120 for breakdown risk. Momentum favours bears. Stochastic RSI confirms this. Another sell-off may follow. Stay cautious. Protect your capital.

Disclaimer
The information discussed by Altcoin Buzz is not financial advice. This is for educational, entertainment, and informational purposes only. Any information or strategies presented are the thoughts and opinions of the writer/reviewers, and their risk tolerance may differ from yours. We are not responsible for any losses you may incur due to any investments directly or indirectly related to the information provided. Solana and other cryptocurrencies are high-risk investments; therefore, please conduct your due diligence. Copyright Altcoin Buzz Pte Ltd.
The post Solana Bulls Eye A Push Through $145 Price To Flip The Trendline appeared first on Altcoin Buzz.