Will $ETH break out or drop hard? Traders are watching this move closely. Look for clear signals in the chart. Read to the end. You’ll find hidden price targets most traders miss.
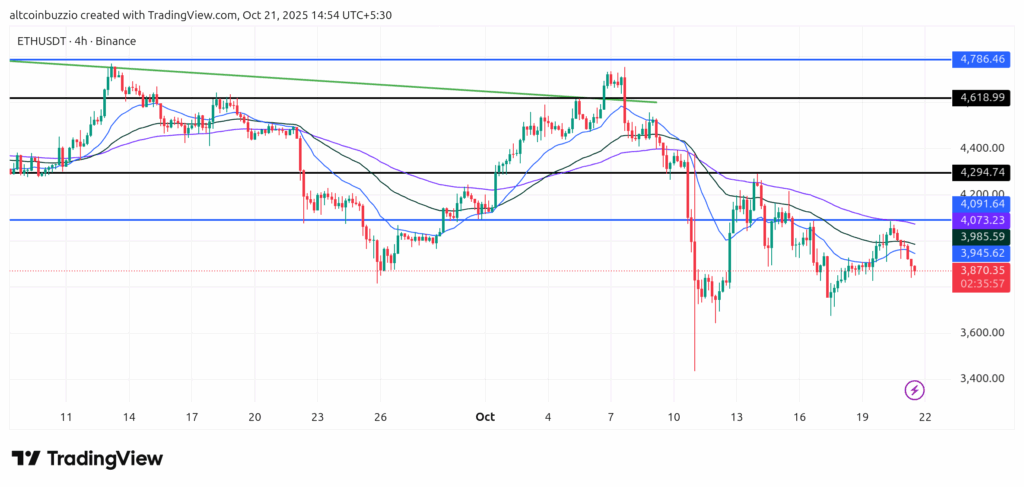
Ethereum trades at $3868 today. $ETH is above the significant support level of $3650. Discover the next targets.
What are the support and resistance levels for $ETH?
| Level | Price (USD) | Description |
|---|---|---|
| Support 1 | $3650 | 100 EMA is the 100-day Exponential Moving Average. It is the average price over the last 100 days. It shows market trends over a mid or long term. |
| Support 2 | $3500 | Bollinger Bands are volatility bands. They expand and contract based on the market volatility. The lower Bollinger Band is the lower deviation from the 20-day simple moving average. |
| Resistance 1 | $3950 | 50 EMA is the 50-day Exponential Moving Average. It is the average price over the last 50 days. It shows market trends over a short or mid-term. |
| Resistance 2 | $4100 | Upper Bollinger Band is the upper deviation from the 20-day simple moving average. |
FAQ
What price targets should I consider for Ethereum $ETH?
Support at $3650. Resistance near $3950. Extension target $5982. Watch these key levels. Price often reacts here. Trade carefully around them.
Should I sell Ethereum to take profits or wait?
Stochastic RSI is 75. Resistance sits at $3950. Place stop-loss below $3650. A break above $3950 could push price higher. A drop below $3650 signals weakness. Plan your trades well.
How do I set stop-loss levels for Ethereum?
Place stops below $3650 support. Consider using swing lows as reference points. A daily close below $3650 is a bearish sign. Protect your capital always.
What are the Ethereum moving averages indicating?
EMA50 is at $3950. EMA100 is at $3650. Ethereum trades at $3868. Compare these values to determine trend direction. The price is currently between EMAs. This suggests indecision. A breakout is likely soon.
What should a buyer or seller do?
Buyers can enter near $3650 or $3500. Place stops below $3500. Sellers can exit near $3950 or $4100. Take profits at $5982. Manage your risk carefully. Always use proper position sizing. Do not over-leverage your trades.
How do Fibonacci levels affect the Ethereum price?
Fibonacci 61.8% level sits at $2964. Fibonacci 138.2% extension targets $5982.
What does $ETH momentum show?
Stochastic RSI K reads 75. Values above 80 mean overbought conditions. Values below 20 mean oversold conditions. And, Values between 20-80 show neutral momentum. Currently, momentum is neutral. It leans slightly bullish. Watch for a shift in trend.
Conclusion
Ethereum holds above $3650 support. Eyes on $3950 for breakout. Momentum is neutral. A push higher is possible. Stay vigilant, manage risk. This level is crucial. Price action will show direction. Be ready for sharp moves. Protect your capital first.

Disclaimer
Altcoin Buzz information is not financial advice. This is for education only. It is also for entertainment. It gives information. Writer’s opinions are personal. Their risk tolerance may vary. We are not responsible for your losses. This includes direct investments. It covers indirect investments too. Ethereum is high-risk. All cryptocurrencies are high-risk. Conduct your own due diligence. Copyright Altcoin Buzz Pte Ltd.
The post Liquidity Map: 3 Entries for Ethereum Near $3,650 appeared first on Altcoin Buzz.